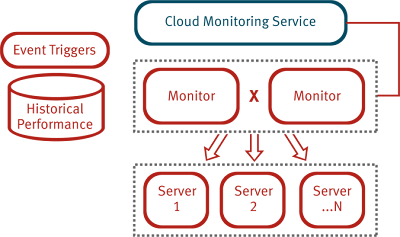
 The Tough Cloud Monitoring solution is our next generation offering targeting virtualized workloads, as well as PaaS services, housed in either traditional data centers or private cloud environments.
 By monitoring, we mean 'health and performance' monitoring of infrastructure and platforms. Our service provides the traditional statistical information: CPU utilization, disk I/O, network traffic, etc. This begs the question, "why does the world need yet-another monitoring solution?" Quite frankly, we were surprised that there weren't better options available on the market. So, once again, we started from scratch with a new design center:
1. Make it massively scalable and highly available
Some of our customers currently have 1,000's of virtualized work loads operating and it is clear that the next generation service providers will have 10's of thousands running. Our design needed to easily scale itself from both a data collection perspective and burst storage. We bit the bullet and designed a solution from scratch to use Apache Cassandra at the core. This enabled us to leverage it's built-in cross-data center peer replication schemes and dynamic partitioning. In addition, Cassandra was a good fit for us because it was designed to accept very fast (stream oriented) writes of data.
2. The monitors should be non-invasive and agent free
Being non-invasive is always a good goal; it makes it easier to collect data on targets without having to install additional software on the machine (which can be a real problem when you already have lots of machines running in production). Knock-on-wood, but so far, we've been able to deliver all of our monitors completely out-of-band. No need to install Ganglia, collectD, etc. on hundreds/thousands of boxes...
3. The monitors should support a standard, service oriented API
In building our early private clouds, we were surprised to see that most of the system monitoring tools were "closed" systems. They collected the data but didn't make it easily available to other systems; they were designed to deliver the information to humans in HTML. This was a non-starter for us since the new world is about achieving higher levels of system automation (not human tasking). Naturally, we went with the de facto standard Amazon Web Services and the CloudWatch API. Our solution delivers full compatibility with CloudWatch from a WSDL, AWS Query and command line perspective. This makes it real easy for the monitoring data to be consumed by other services like Auto Scale.
4. Use a consistent model for IaaS and PaaS
By supporting the AWS service interface model, we inherited this feature. Just as CloudWatch monitors services like their Elastic Load Balancer and Relational Data Services, we'll be providing similar support for internal PaaS platforms.
We believe that we have achieved all of our design goals. The Tough Cloud Monitor is available today for traditional data centers, private clouds or service providers.
No comments:
Post a Comment